It takes multiple partners to deliver whole-person health at scale. That means disparate data.
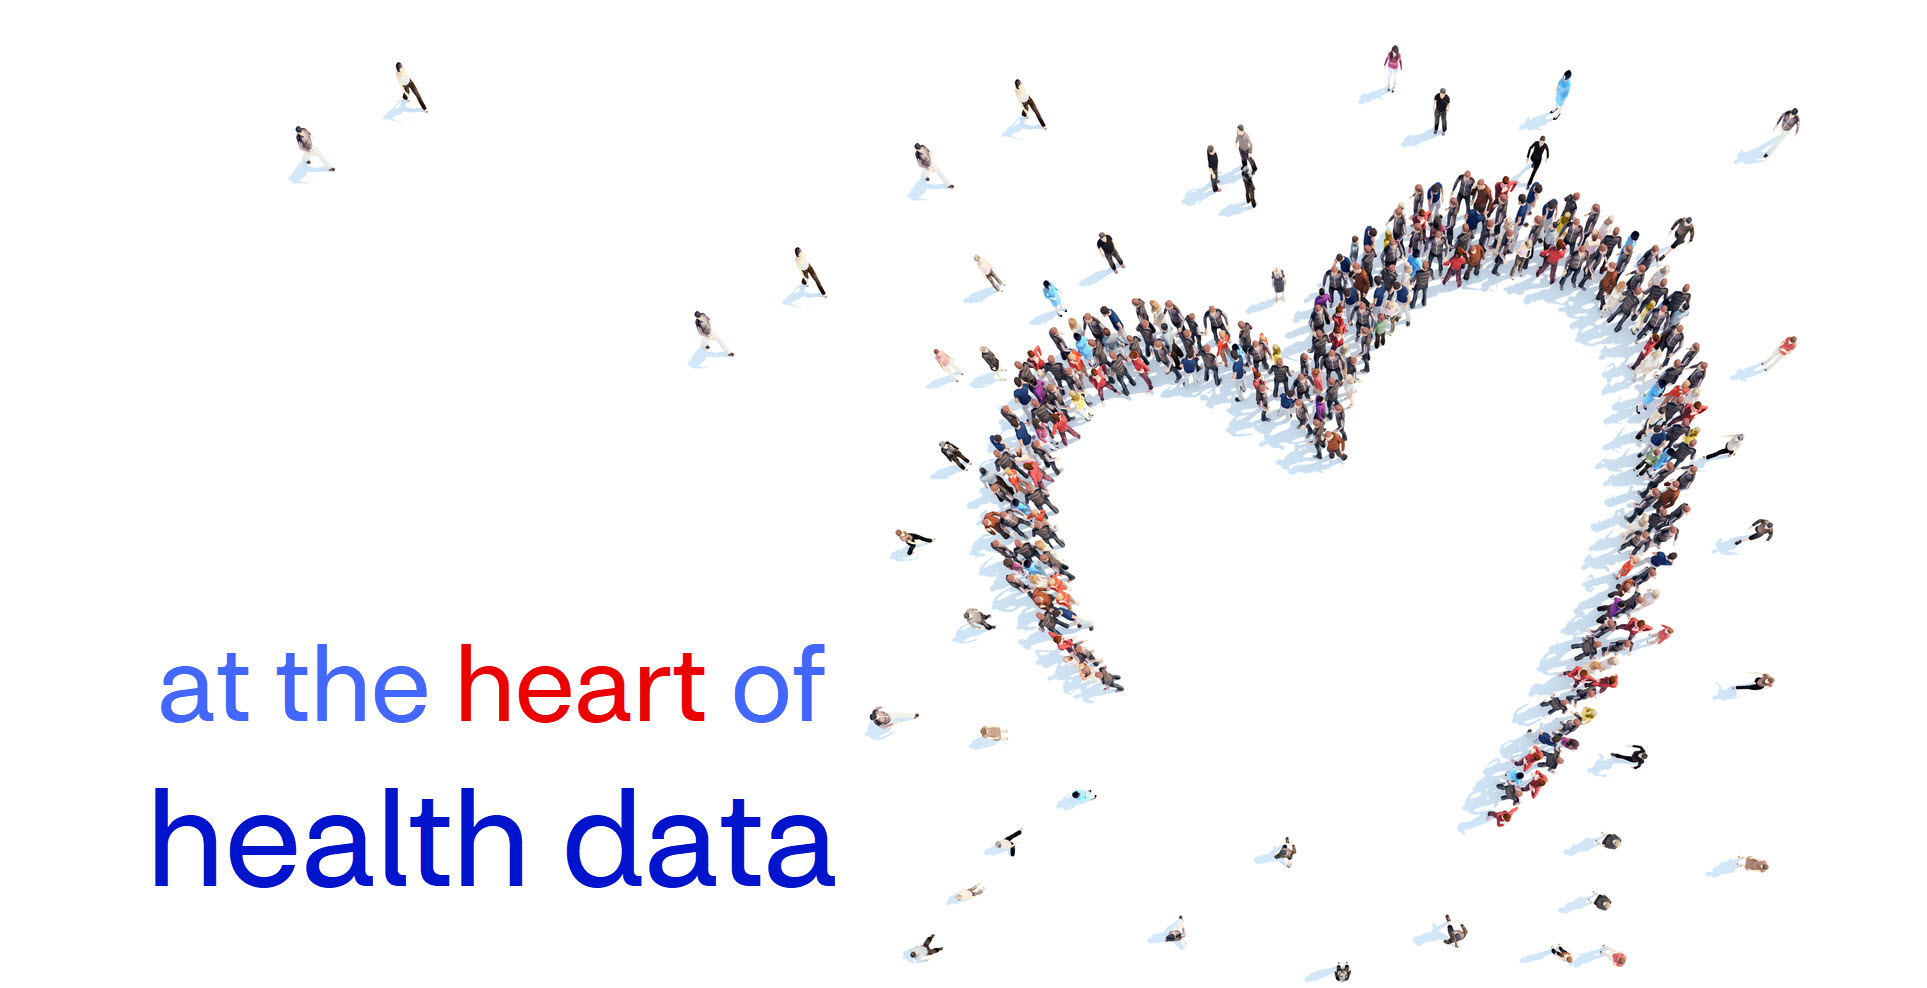
Because we’re at the heart of health data, we deliver smart solutions to make healthier happen, together.

These tell us what the population should and does look like.
– Teena K.
It’s what this is all about. All the data in the world is meaningless unless we transform it for insights. The ultimate goal is to make every member’s healthcare experience benefit from these analytics.
– Gloria O.
These offer both analytic value and the opportunity to help people who may need it the most.
– Alison B.

When creating a Dynamic Grouping cohort, don’t forget about the “Enter Values To Link” button on the Manage Groups page. This will allow you to copy/paste multiple values into Enlight and may make your cohort-building process much faster.
– Alex M.

Always validate your results, never take a number at face value. Know how you or the system got that number. I like to use commentary cells as helpful notes for myself and others to document how or why a report was set up a certain way.
– Wes A.

When I start new reporting projects, I always ask “What story are you looking to tell?” In addition to data visualization design I use the Stories feature in Enlight to organize analytics so they tell a logical, cohesive story.
– Allyson P.

This mosaic is the people of HDMS. Our software and insights change lives. Decision makers can finally see whole-person health at scale in a simple and impactful way, customized for their organization’s needs.
We lead with innovation, grounded in wisdom. We embrace the opportunities available through analytics, big data and artificial intelligence.
And most importantly, we believe personal connection makes a difference.

Learn more about Enlight – the Health Data platform this Analytics Practice uses for deep connected health insights!
Meet Enlight