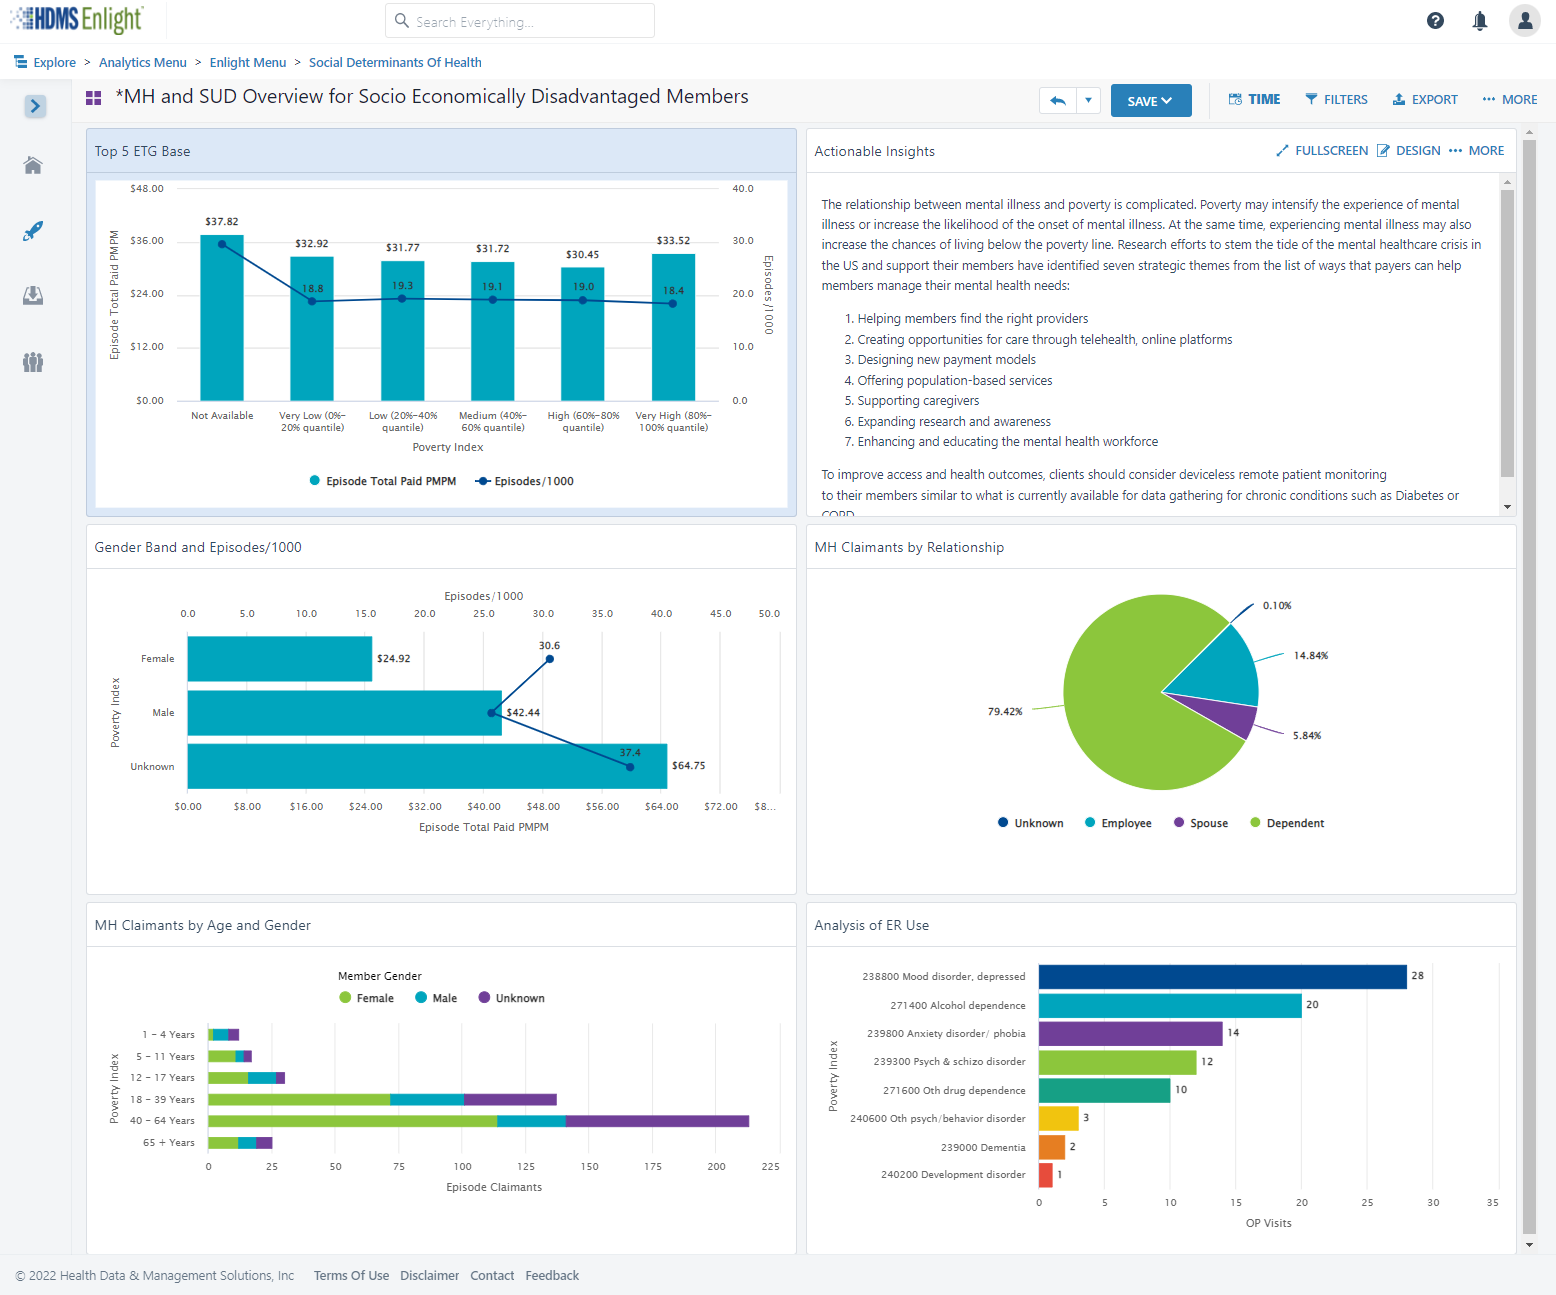
SDoH analytics requires a lot of data, and different types of data. Claims data tells us about health care visits. Digital device data tells us about daily health. And special data sets let us delineate the social and environmental factors that could influence each member.
In SDoH analytics, we understand each person as an individual and in context, but look at a community as a whole in aggregate, to see what trends and patterns emerge.

Here are 5 important aspects to consider, and tips of what to look for, so you can trust the insights in your SDoH analytic endeavors.
Wellness means care and lifestyle choices. This data is scattered across many different places. Health analytics must integrate complex claims data structures and lifestyle data at an individual person level. SDoH analytics should also be connected at a person level. This way, the data is ready to serve all the analytic questions you may ask, without additional data preparation and delays.

The more granular a data set is, and assuming it is associated at a member-specific level, the more trustworthy and usable your SDoH insights will be. Think about the variation of social and environmental factors you see across an entire zip code. Now think about the degree of variation you see within a neighborhood. A Census Block Group is akin to a neighborhood. This means if you have source data that has a Census Block Group level of granularity, you are seeing only the degree of variation across neighborhoods, not entire zip codes.

Social and environmental factors cover a broad range of influences on health. Air quality or water quality? Economic hardship or transportation access? There is so much we can do if we have lots of different SDoH indices to choose from. For instance, one HDMS client is looing at the transporation index alongside the technology index to assess the potential usefulness and impact of a mobile unit verse a virtual solution for specific care services. Locations with low transporation AND low technology indices are prioritized for mobile services, while other locations are suitable for virtual care alternatives.

HDMS offers over 25 SDoH indices and dimensions.
Start with composite indices that allow you to look broadly across a number of factors at once. Use focused indices to support very specific or nuanced investigations, like food access or social isolation. They can also be used together – for instance the transportation index and the technology index example we shared above.
Have a good understanding of which social or environmental factor you are investigating and where that index is sourced. There are a wide variety of options. Nothing will be perfect. Some indices are more complete, more granular, more recently or frequently updated, than others. As you interpret results, have transparency around the process leading to the metrics. This will help everyone interpret and apply insights better in the long run.

TIP: Enriching claim data delivers fast and intuitive investigations. This makes SDoH analytics easier too.
Enrichment can have many forms: classify claims by episode treatment groups (ETG), apply pharmaceutical classifications, and flag specialty druges. Enrichment processing also identifies gaps in care and low value care and makes it easy to surface these individual moments into analytics.
ER visits that have been classified using the NYU methodology allow you to quickly look at who visited the ER for non-emergent care, just by using a few filters. Now think how powerful it is to further see these visits by income index.
As we think about integrating new data to investigate social determinants of health, we naturally focus on the new data – the addition. But we need to link that to core health data. Let’s not forget the quality and usability of those systems or sources. The data quality processes surrounding your traditional analytics are a critical part of trusted SDoH insights.

HDMS Enlight offers the most comprehensive out of the box SDoH analytics on the market.
Explore SDoH Analytics Contact us